LLM Observability and Tracing: How to Debug Prompts, Retrieval, Tools, and Failures
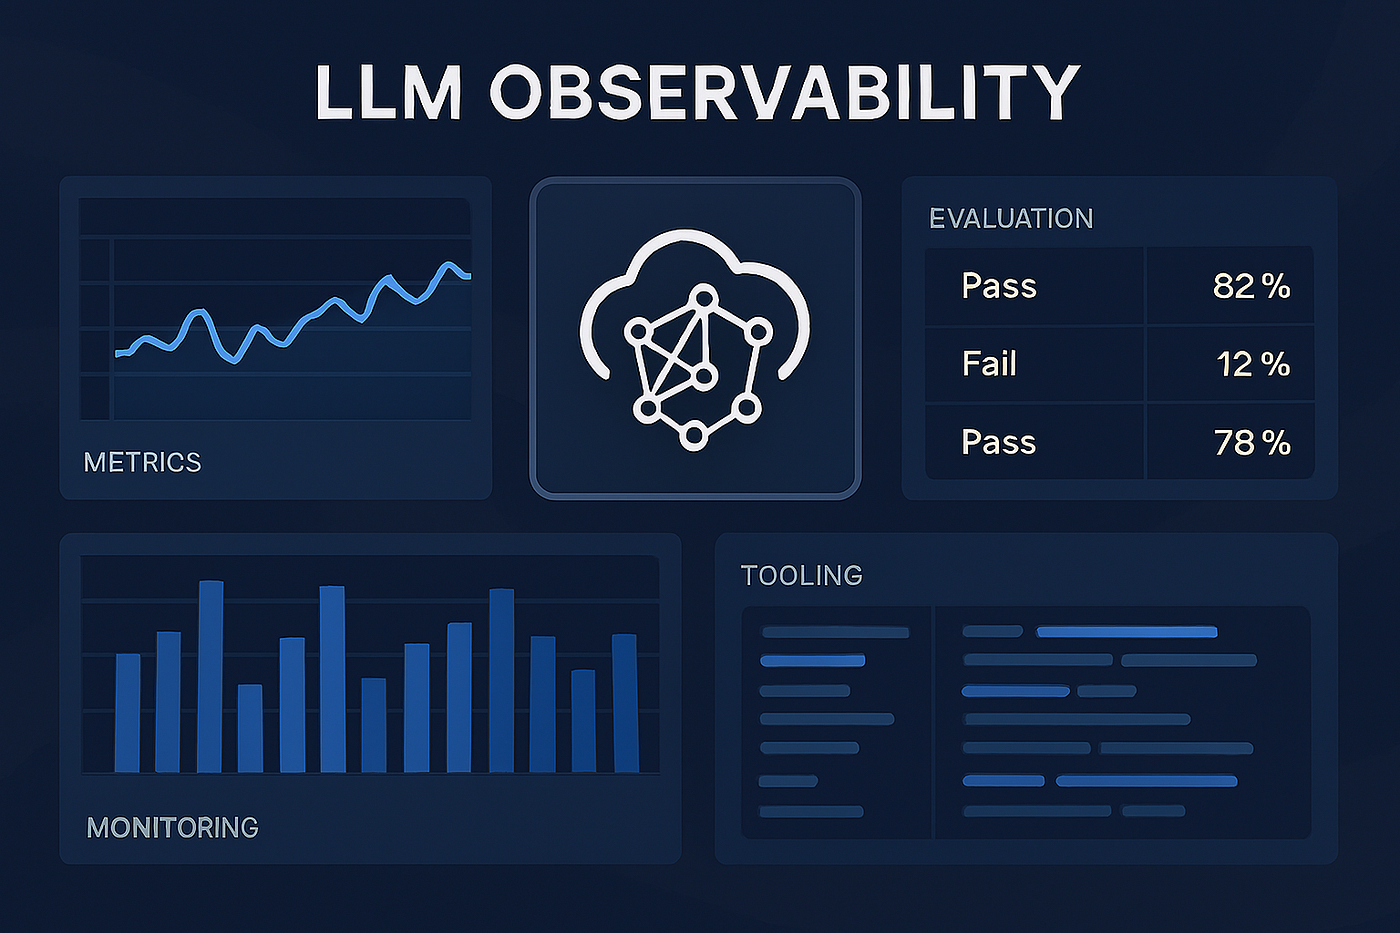
LLM applications are difficult to debug when all you log is the final answer. By the time a user sees a bad response, the underlying cause may be several steps upstream: a bad retrieval result, an overly broad prompt, a tool error, malformed intermediate state, or a schema validation failure.
This is why observability is a first-class requirement for serious LLM systems. If you cannot trace what happened across the prompt, retrieval, tool, and output layers, you will spend too much time guessing at root causes. In mature systems, observability is not just for incident response. It is also the foundation for evaluation, release management, cost control, and governance.
Why Traditional Logging Falls Short
Standard application logs usually capture request IDs, response codes, and backend exceptions. That is not enough for LLM systems. You also need visibility into model-facing behavior.
Useful traces often include:
- prompt version
- system and user messages
- retrieved documents
- tool calls and arguments
- structured outputs
- validation failures
- token counts
- model latency
Without this, debugging becomes anecdotal. Teams start arguing about whether the model is weak, the prompt is bad, or retrieval failed, without enough evidence to answer any of those questions cleanly.
The Minimum Useful Trace
For each request, a strong trace should answer:
- what input the system received
- what context it added
- what prompt template was used
- which model was called
- what tools were invoked
- what validations passed or failed
- what answer was returned
That sequence is often enough to localize most failures quickly. A high-quality trace turns an opaque generation pipeline into an explainable sequence of events.
Observability for Prompts
Prompt behavior is often treated as something too subjective to measure. That is a mistake. Prompt-level observability should include:
- prompt template identifier
- prompt length in tokens
- dynamic variables injected into the template
- system instruction set
- response format requested
- fallback prompts triggered during retries
This matters because prompt changes are product changes. If a prompt is updated and latency increases by 25% or schema validity drops, the trace should make that relationship visible.
Observability for Retrieval
Retrieval errors are among the most common causes of poor LLM behavior. Good observability should therefore capture:
- query used for retrieval
- documents returned
- document scores or ranks
- metadata filters applied
- reranking outcomes
- context actually sent to the model
This matters because the document that was retrieved is not always the document that was included in the final prompt. In many systems, failures happen not because retrieval found nothing, but because context assembly selected the wrong passages or overfilled the context window with noise.
Observability for Tool Use
When models can call tools, tracing must include:
- tool selected
- arguments generated by the model
- tool execution success or failure
- retries and fallback behavior
- whether the tool result was actually used in the final answer
A system that calls many tools is not necessarily intelligent. It may simply be poorly constrained. Observability helps distinguish effective tool use from thrashing behavior.
State Transitions Matter in Agentic Systems
For multi-step systems, traces should not stop at input and output. They should expose state transitions:
- current plan state
- branch taken at decision nodes
- retry counts
- human-approval checkpoints
- termination reason
Without this, agentic workflows become difficult to audit. A final answer may look wrong, but the deeper issue could be that the system took the wrong branch six steps earlier.
Metrics to Track Over Time
Operational dashboards for LLM systems should usually include:
- request volume
- token consumption
- average and p95 latency
- structured output validity rate
- retrieval hit rate or grounded answer rate
- tool success rate
- refusal rate
- user feedback or human-review disagreement rate
These metrics help turn qualitative complaints into diagnosable patterns. They also make it possible to track drift after model upgrades, prompt edits, or corpus changes.
Cost Observability Is Part of Reliability
A system that answers correctly but at unsustainable cost is not healthy. Strong observability should therefore track:
- cost per request
- cost per successful task
- average prompt size
- average retrieved context size
- cost spikes by route or feature
This often reveals opportunities that quality-only dashboards miss. For example, an expensive chain of retries may improve quality only marginally while doubling serving cost.
Privacy and Governance Considerations
Observability must be designed with governance in mind. Prompt and response logs may contain sensitive data. That means teams need policies for:
- redaction
- retention limits
- access control
- environment separation
- auditability
Strong observability does not mean logging everything carelessly. It means logging enough to diagnose behavior while preserving legal, security, and privacy constraints.
A Practical Maturity Model
You can think about observability maturity in stages:
- basic request and response logging
- prompt and retrieval tracing
- tool and state-transition tracing
- integrated quality, cost, and safety dashboards
- continuous correlation between traces and evaluation failures
Teams that reach the later stages can improve systems much faster because they spend less time guessing and more time fixing the right layer.
Technical Appendix: Trace Record Example
1
2
3
4
5
6
7
8
9
{
  "request_id": "req_1842",
  "prompt_version": "support_v7",
  "retrieved_doc_ids": ["doc_12", "doc_98"],
  "tool_calls": [{"tool": "crm_lookup", "status": "success"}],
  "schema_valid": true,
  "latency_ms": 1640,
  "cost_usd": 0.009
}
Trace structures like this make it possible to correlate poor answers with retrieval quality, tool behavior, prompt versions, or latency regressions.
Implementing Observability: Code Patterns
Structured Logging
The simplest starting point is structured, machine-readable log records for every inference request:
1
2
3
4
5
6
7
8
9
10
11
12
13
14
15
16
17
18
19
20
21
22
23
24
25
26
27
28
29
30
31
32
33
34
35
36
37
38
39
40
41
42
43
44
45
46
47
48
49
50
51
52
53
54
55
56
57
58
import json
import time
import uuid
import logging
from datetime import datetime

logger = logging.getLogger("llm_observability")
logger.setLevel(logging.INFO)

class LLMObserver:
    """Wraps an LLM client with structured observability."""

    def __init__(self, llm_client, logger=logger):
        self.llm   = llm_client
        self.logger = logger

    def invoke(self, prompt: str, prompt_version: str = "unknown", **kwargs) -> dict:
        request_id  = str(uuid.uuid4())
        start_time  = time.perf_counter()
        timestamp   = datetime.utcnow().isoformat()

        trace = {
            "request_id":     request_id,
            "timestamp":      timestamp,
            "prompt_version": prompt_version,
            "input_length":   len(prompt),
            "prompt_tokens":  None,
            "completion_tokens": None,
            "latency_ms":     None,
            "cost_usd":       None,
            "schema_valid":   None,
            "error":          None,
        }

        try:
            response = self.llm.invoke(prompt, **kwargs)
            elapsed  = (time.perf_counter() - start_time) * 1000

            trace["latency_ms"]         = round(elapsed, 2)
            trace["prompt_tokens"]      = response.usage.prompt_tokens
            trace["completion_tokens"]  = response.usage.completion_tokens
            trace["cost_usd"]           = self._estimate_cost(
                response.usage.prompt_tokens,
                response.usage.completion_tokens,
            )
            trace["schema_valid"] = True
            self.logger.info(json.dumps(trace))
            return response

        except Exception as e:
            trace["error"]      = str(e)
            trace["latency_ms"] = round((time.perf_counter() - start_time) * 1000, 2)
            self.logger.error(json.dumps(trace))
            raise

    def _estimate_cost(self, prompt_tokens: int, completion_tokens: int) -> float:
        # gpt-4o pricing (adjust per model)
        return round(prompt_tokens * 2.5e-6 + completion_tokens * 10e-6, 6)
LangSmith Integration
LangSmith is the reference platform for LangChain-based LLM observability. It automatically captures traces, inputs, outputs, latency, and evaluation scores.
1
2
3
4
5
6
7
8
9
10
11
12
13
14
15
16
17
18
19
20
21
22
23
24
import os
from langchain_openai import ChatOpenAI
from langchain_core.prompts import ChatPromptTemplate
from langchain_core.output_parsers import StrOutputParser

# Enable tracing — set once in environment or at startup
os.environ["LANGCHAIN_TRACING_V2"] = "true"
os.environ["LANGCHAIN_API_KEY"]     = "ls__your_langsmith_key"
os.environ["LANGCHAIN_PROJECT"]     = "production-support-assistant"
os.environ["LANGCHAIN_ENDPOINT"]    = "https://api.smith.langchain.com"

llm    = ChatOpenAI(model="gpt-4o-mini", temperature=0)
prompt = ChatPromptTemplate.from_messages([
    ("system", "You are a helpful support assistant. Answer based only on the provided context."),
    ("human",  "Context:\n{context}\n\nQuestion: {question}")
])
parser = StrOutputParser()
chain  = prompt | llm | parser

# All invocations are automatically traced in LangSmith
result = chain.invoke({
    "context":  "Our return policy allows returns within 30 days.",
    "question": "Can I return an item after 3 weeks?"
})
Adding Custom Metadata
1
2
3
4
5
6
7
8
9
10
11
12
from langsmith import traceable, Client
from langsmith.run_helpers import get_current_run_tree

@traceable(name="rag_pipeline", tags=["production", "v2"])
def rag_pipeline(question: str, user_id: str) -> str:
    run_tree = get_current_run_tree()
    if run_tree:
        run_tree.add_metadata({"user_id": user_id, "feature_flag": "rag_v2"})

    docs    = retriever.invoke(question)
    context = "\n".join(d.page_content for d in docs)
    return chain.invoke({"context": context, "question": question})
Programmatic Evaluation via LangSmith
1
2
3
4
5
6
7
8
9
10
11
12
13
14
15
16
17
18
19
20
21
22
23
24
25
26
27
28
29
30
31
from langsmith import Client
from langsmith.evaluation import evaluate

client = Client()

# Define evaluation dataset
dataset = client.create_dataset("hr-policy-qa")
client.create_examples(
    inputs=[{"question": "What is the PTO policy?"}],
    outputs=[{"answer": "Employees receive 15 days PTO per year."}],
    dataset_id=dataset.id,
)

# Define evaluator functions
def faithfulness_evaluator(run, example):
    score = judge_faithfulness(run.outputs["output"], example.outputs["answer"])
    return {"key": "faithfulness", "score": score}

def relevance_evaluator(run, example):
    score = judge_relevance(run.inputs["question"], run.outputs["output"])
    return {"key": "relevance", "score": score}

# Run evaluation against the dataset
results = evaluate(
    rag_pipeline,
    data=dataset.name,
    evaluators=[faithfulness_evaluator, relevance_evaluator],
    experiment_prefix="rag-v2-test",
    max_concurrency=5,
)
print(results.to_pandas())
OpenTelemetry Traces
For vendor-neutral observability, OpenTelemetry spans integrate LLM traces into your existing APM stack (Datadog, Grafana Tempo, Jaeger, etc.).
1
2
3
4
5
6
7
8
9
10
11
12
13
14
15
16
17
18
19
20
21
22
23
24
25
26
27
28
29
30
31
32
33
34
35
36
37
38
39
40
41
42
43
44
45
46
47
48
from opentelemetry import trace
from opentelemetry.sdk.trace import TracerProvider
from opentelemetry.sdk.trace.export import BatchSpanProcessor
from opentelemetry.exporter.otlp.proto.grpc.trace_exporter import OTLPSpanExporter
from opentelemetry.sdk.resources import Resource

# Configure OTLP exporter (e.g., Grafana Tempo / Datadog)
resource = Resource.create({"service.name": "llm-service", "deployment.environment": "prod"})
provider = TracerProvider(resource=resource)
provider.add_span_processor(
    BatchSpanProcessor(OTLPSpanExporter(endpoint="http://tempo:4317"))
)
trace.set_tracer_provider(provider)
tracer = trace.get_tracer("llm-observability")

def traced_llm_call(prompt: str, prompt_version: str) -> str:
    with tracer.start_as_current_span("llm.completion") as span:
        span.set_attributes({
            "llm.prompt_version": prompt_version,
            "llm.input.token_count": count_tokens(prompt),
            "llm.model": "gpt-4o-mini",
        })

        try:
            response = llm.invoke(prompt)
            span.set_attributes({
                "llm.output.token_count": response.usage.completion_tokens,
                "llm.latency_ms":         response.response_ms,
                "llm.cost_usd":           estimate_cost(response.usage),
            })
            span.set_status(trace.StatusCode.OK)
            return response.content

        except Exception as e:
            span.record_exception(e)
            span.set_status(trace.StatusCode.ERROR, str(e))
            raise

# Retrieval span
def traced_retrieval(query: str, retriever) -> list:
    with tracer.start_as_current_span("retrieval.search") as span:
        span.set_attribute("retrieval.query", query)
        docs = retriever.invoke(query)
        span.set_attributes({
            "retrieval.result_count": len(docs),
            "retrieval.doc_ids":      [d.metadata.get("id") for d in docs],
        })
        return docs
Phoenix / Arize for LLM Observability
Phoenix by Arize provides a local-first observability UI optimized for LLM traces and embedding drift.
1
2
3
4
5
6
7
8
9
10
11
12
13
14
15
16
17
18
19
20
21
import phoenix as px
from phoenix.otel import register

# Start the Phoenix server (in-process for dev, separate for prod)
session = px.launch_app()

# Register OpenTelemetry tracer pointing to Phoenix
tracer_provider = register(
    project_name="my-llm-project",
    endpoint="http://localhost:6006/v1/traces",
)

# Phoenix auto-instruments LangChain, OpenAI SDK, LlamaIndex
from openinference.instrumentation.langchain import LangChainInstrumentor
from openinference.instrumentation.openai import OpenAIInstrumentor

LangChainInstrumentor().instrument(tracer_provider=tracer_provider)
OpenAIInstrumentor().instrument(tracer_provider=tracer_provider)

# All subsequent LangChain/OpenAI calls are automatically traced
# Traces appear in the Phoenix UI at http://localhost:6006
Retrieval-Specific Tracing
Retrieval failures are among the most common causes of poor LLM outputs. Capture them explicitly:
1
2
3
4
5
6
7
8
9
10
11
12
13
14
15
16
17
18
19
20
21
22
23
24
25
26
27
28
29
30
31
32
33
34
35
36
37
38
39
40
41
def traced_rag_pipeline(question: str) -> dict:
    with tracer.start_as_current_span("rag_pipeline") as root_span:
        root_span.set_attribute("question", question)

        # Retrieval span
        with tracer.start_as_current_span("retrieval") as ret_span:
            docs = retriever.invoke(question)
            ret_span.set_attributes({
                "retrieval.query":        question,
                "retrieval.doc_count":    len(docs),
                "retrieval.scores":       [d.metadata.get("score", 0) for d in docs],
                "retrieval.doc_ids":      [d.metadata.get("source", "") for d in docs],
            })

        # Reranking span
        with tracer.start_as_current_span("reranking") as rank_span:
            ranked_docs = reranker.compress_documents(docs, question)
            rank_span.set_attributes({
                "reranking.input_count":  len(docs),
                "reranking.output_count": len(ranked_docs),
            })

        # Context assembly span
        with tracer.start_as_current_span("context_assembly") as ctx_span:
            context = "\n\n".join(d.page_content for d in ranked_docs)
            ctx_span.set_attributes({
                "context.char_length":    len(context),
                "context.token_estimate": len(context) // 4,
            })

        # Generation span
        with tracer.start_as_current_span("generation") as gen_span:
            answer = llm.invoke(build_prompt(question, context))
            gen_span.set_attributes({
                "generation.model":            "gpt-4o-mini",
                "generation.input_tokens":     answer.usage.prompt_tokens,
                "generation.completion_tokens": answer.usage.completion_tokens,
                "generation.cost_usd":          estimate_cost(answer.usage),
            })

        return {"answer": answer.content, "docs": ranked_docs}
Metrics Dashboard Design
A production LLM observability dashboard should include at minimum:
Tier 1 — SLA metrics (alert on these)
| Metric | Alert Threshold | Panel Type |
|---|---|---|
| p95 latency | > 5 seconds | Line chart |
| Error rate | > 1% over 5 min | Line chart + alert |
| Schema validation failure rate | > 0.5% | Bar chart |
| Cost per request (hourly) | > $0.05 | Gauge |
Tier 2 — Quality metrics (review daily)
| Metric | Normal Range | Panel Type |
|---|---|---|
| Faithfulness score (LLM judge) | > 0.80 | Time series |
| Relevance score | > 0.75 | Time series |
| Refusal rate | 1–5% | Bar chart |
| Tool success rate | > 95% | Gauge |
| Retrieval hit rate | > 70% | Line chart |
Tier 3 — Capacity metrics (review weekly)
| Metric | Panel Type |
|---|---|
| Token consumption by model | Stacked bar |
| Request volume by feature/route | Heat map |
| Cost breakdown (prompt vs completion) | Pie chart |
| Latency by prompt version | Multi-line chart |
Alerting Rules
1
2
3
4
5
6
7
8
9
10
11
12
13
14
15
16
17
18
19
20
21
22
23
24
25
26
27
28
29
30
31
32
33
34
# Prometheus alerting rules for LLM systems
groups:
  - name: llm_sla
    rules:
    - alert: LLMHighLatency
      expr: histogram_quantile(0.95, sum(rate(llm_request_latency_seconds_bucket[5m])) by (le)) > 5
      for: 2m
      labels:
        severity: warning
      annotations:
        summary: "LLM p95 latency exceeds 5s"

    - alert: LLMHighErrorRate
      expr: rate(llm_requests_total{status="error"}[5m]) / rate(llm_requests_total[5m]) > 0.01
      for: 2m
      labels:
        severity: critical
      annotations:
        summary: "LLM error rate above 1%"

    - alert: LLMSchemaValidationFailures
      expr: rate(llm_schema_validation_failures_total[10m]) > 0.005
      for: 5m
      labels:
        severity: warning
      annotations:
        summary: "LLM schema validation failures elevated"

    - alert: LLMCostSpike
      expr: increase(llm_cost_usd_total[1h]) > 100
      labels:
        severity: warning
      annotations:
        summary: "LLM cost exceeded $100 in last hour"
Privacy-Compliant Logging
Observability must be designed with governance in mind:
1
2
3
4
5
6
7
8
9
10
11
12
13
14
15
16
17
18
19
20
21
22
23
24
25
26
27
28
29
30
31
32
33
import re
from typing import Optional

class PrivacyAwareLLMLogger:
    # Patterns to redact from logs
    PII_PATTERNS = {
        "email":      re.compile(r'[a-zA-Z0-9._%+-]+@[a-zA-Z0-9.-]+\.[a-zA-Z]{2,}'),
        "phone":      re.compile(r'\b\d{3}[-.\s]?\d{3}[-.\s]?\d{4}\b'),
        "ssn":        re.compile(r'\b\d{3}-\d{2}-\d{4}\b'),
        "credit_card": re.compile(r'\b(?:\d{4}[- ]){3}\d{4}\b'),
        "ip_address": re.compile(r'\b\d{1,3}\.\d{1,3}\.\d{1,3}\.\d{1,3}\b'),
    }

    def redact(self, text: str) -> str:
        for name, pattern in self.PII_PATTERNS.items():
            text = pattern.sub(f"[REDACTED_{name.upper()}]", text)
        return text

    def log_trace(self, trace: dict) -> None:
        safe_trace = {
            "request_id":     trace["request_id"],
            "timestamp":      trace["timestamp"],
            "prompt_version": trace["prompt_version"],
            # Redact content — log only metadata
            "input_token_count":  trace.get("prompt_tokens"),
            "output_token_count": trace.get("completion_tokens"),
            "latency_ms":         trace.get("latency_ms"),
            "cost_usd":           trace.get("cost_usd"),
            "schema_valid":       trace.get("schema_valid"),
            "route":              trace.get("route"),
            # Never log raw prompt or response in production
        }
        logger.info(json.dumps(safe_trace))
Observability Maturity Model
| Stage | Capabilities | Teams at This Stage |
|---|---|---|
| Level 0 — Blind | No logging | Prototype only |
| Level 1 — Basic | Request/response logging, latency | Early production |
| Level 2 — Tracing | Prompt/retrieval/tool spans, token counts | Growing teams |
| Level 3 — Quality | Automated faithfulness/relevance scores, cost dashboards | Mature production |
| Level 4 — Integrated | Traces linked to eval failures, CI/CD quality gates, SLA dashboards | Advanced teams |
| Level 5 — Continuous | Real-time drift detection, automatic root-cause correlation | Enterprise LLM platforms |
Operational Runbook Template
Every production LLM system should have a runbook that answers:
LLM System Runbook — Support Assistant
Latency SLO: p95 < 3s
Symptoms: Users reporting slow responses; p95 > 5s in dashboard
Investigation:
- Check
llm_request_latency_secondsby component (retrieval vs generation vs tool) - Check if a specific prompt_version introduced the regression
- Check queue depth — scaling may be needed
- Check retrieval latency separately from model latency
Remediation:
- If retrieval is slow: check vector DB load, consider metadata pre-filter
- If generation is slow: check GPU utilization, consider smaller model on easy tasks
- If overall volume spike: trigger autoscaling rule
Quality SLO: faithfulness > 0.80
Symptoms: LLM-as-judge faithfulness drops below 0.80 for 30+ minutes
Investigation:
- Check whether retrieval quality dropped (retrieval hit rate, document scores)
- Check whether a prompt update was deployed
- Sample failing traces manually in LangSmith
Remediation:
- Roll back prompt version if a recent update is the cause
- Check corpus for stale or corrupted documents
Langfuse: Open-Source LLM Observability
Langfuse is a popular open-source alternative to LangSmith, offering self-hosting and fine-grained cost tracking:
1
2
3
4
5
6
7
8
9
10
11
12
13
14
15
16
17
18
19
20
21
22
23
24
25
26
27
28
29
30
31
32
33
34
35
36
37
38
39
from langfuse import Langfuse
from langfuse.decorators import observe, langfuse_context

langfuse = Langfuse(
    public_key="pk-lf-...",
    secret_key="sk-lf-...",
    host="https://cloud.langfuse.com",  # or self-hosted URL
)

@observe()
def rag_pipeline(question: str, user_id: str) -> str:
    # Automatically creates a trace in Langfuse
    langfuse_context.update_current_trace(
        user_id=user_id,
        metadata={"feature": "hr-assistant"},
    )

    # Nested spans are created automatically for each @observe call
    docs    = retrieve_docs(question)
    context = "\n".join(d.text for d in docs)

    langfuse_context.update_current_observation(
        metadata={"doc_count": len(docs)},
    )

    return generate_answer(question, context)

@observe(name="retrieve_docs")
def retrieve_docs(question: str) -> list:
    return retriever.invoke(question)

@observe(name="generate_answer")
def generate_answer(question: str, context: str) -> str:
    response = llm.invoke(f"Context:\n{context}\n\nQ: {question}")
    langfuse_context.update_current_observation(
        usage={"input": response.usage.prompt_tokens, "output": response.usage.completion_tokens},
        model="gpt-4o-mini",
    )
    return response.content
Manual Langfuse tracing
1
2
3
4
5
6
7
8
9
10
11
12
13
14
15
16
17
18
19
20
21
22
23
24
25
26
27
28
29
30
31
32
from langfuse import Langfuse

langfuse = Langfuse()

# Create a trace
trace = langfuse.trace(
    name="support-assistant",
    user_id="user_12345",
    metadata={"session_id": "sess_abc"},
)

# Create spans for each step
retrieval_span = trace.span(name="retrieval", input={"query": question})
docs           = retriever.invoke(question)
retrieval_span.end(output={"doc_count": len(docs)})

generation_span = trace.span(name="generation")
response        = llm.invoke(build_prompt(question, docs))
generation_span.end(
    output={"answer": response.content[:100]},
    usage={"promptTokens": response.usage.prompt_tokens, "completionTokens": response.usage.completion_tokens},
    model="gpt-4o-mini",
    level="DEFAULT",
)

# Score the trace (e.g., from user feedback)
langfuse.score(
    trace_id=trace.id,
    name="user_satisfaction",
    value=5,  # thumbs up = 5, thumbs down = 1
    comment="User clicked helpful",
)
Distributed Tracing with W&B Weave
1
2
3
4
5
6
7
8
9
10
11
12
13
14
15
16
17
18
19
20
21
22
23
24
25
26
27
28
29
30
31
32
import weave
from openai import OpenAI

weave.init("my-llm-project")

client = OpenAI()

@weave.op()
def retrieve(query: str) -> list[dict]:
    docs = retriever.invoke(query)
    return [{"text": d.page_content, "source": d.metadata.get("source")} for d in docs]

@weave.op()
def generate(question: str, context: str) -> str:
    response = client.chat.completions.create(
        model="gpt-4o-mini",
        messages=[
            {"role": "system", "content": "Answer based only on the context."},
            {"role": "user",   "content": f"Context: {context}\n\nQuestion: {question}"},
        ],
    )
    return response.choices[0].message.content

@weave.op()
def rag_pipeline(question: str) -> dict:
    docs    = retrieve(question)
    context = "\n\n".join(d["text"] for d in docs)
    answer  = generate(question, context)
    return {"question": question, "answer": answer, "doc_count": len(docs)}

# All calls are automatically traced in W&B Weave
result = rag_pipeline("What are the benefits of RAG over fine-tuning?")
Sampling-Based Observability for Cost Control
Full tracing of every request is expensive at scale. Use sampling:
1
2
3
4
5
6
7
8
9
10
11
12
13
14
15
16
17
18
19
20
21
22
23
24
25
26
27
28
29
30
31
32
33
34
35
36
37
38
39
40
41
42
43
44
45
46
47
48
import random
import time

class SampledObserver:
    def __init__(
        self,
        base_sample_rate:    float = 0.05,   # 5% of all requests
        error_sample_rate:   float = 1.00,   # 100% of errors
        slow_sample_rate:    float = 1.00,   # 100% of slow requests
        slow_threshold_ms:   float = 5000,
    ):
        self.base_rate  = base_sample_rate
        self.error_rate = error_sample_rate
        self.slow_rate  = slow_sample_rate
        self.slow_ms    = slow_threshold_ms

    def should_trace(
        self,
        latency_ms:   float = 0,
        had_error:    bool  = False,
        force_trace:  bool  = False,
    ) -> bool:
        if force_trace:
            return True
        if had_error:
            return random.random() < self.error_rate
        if latency_ms > self.slow_ms:
            return random.random() < self.slow_rate
        return random.random() < self.base_rate

sampled_observer = SampledObserver(base_sample_rate=0.05)

def observed_request(question: str, llm) -> str:
    t0       = time.perf_counter()
    error    = False
    try:
        result = llm.invoke(question).content
    except Exception as e:
        error  = True
        result = ""
        raise
    finally:
        latency = (time.perf_counter() - t0) * 1000
        if sampled_observer.should_trace(latency_ms=latency, had_error=error):
            # Log full trace
            pass   # emit to observability backend

    return result
Observability Engineering Principles
- Trace every layer: Input, retrieval, generation, tool calls, and validation each get their own span
- Log metadata, not content: Redact prompt and response content from logs; log only token counts, costs, and IDs
- Sample intelligently: 100% tracing is expensive; sample 5–10% normally, 100% on errors and slow requests
- Correlate traces to eval failures: When an automated judge flags a response, the trace must tell you why
- Monitor cost by route/feature: Cost spikes often originate from one unexpected use pattern
- Alert on quality, not just errors: A 10% faithfulness drop is as serious as a 10% error rate
- Trace format is a contract: Breaking trace schema changes downstream dashboards and alerts
- Privacy is part of observability design: Define retention policies and access controls before collecting data
Observability Quick Reference
| What to Trace | Why | Tool |
|---|---|---|
| Input prompt + version | Attribution of behavior | LangSmith trace metadata |
| Retrieved doc IDs + scores | Diagnose RAG failures | Custom span attributes |
| Tool calls + arguments | Debug tool misuse | OTel tool span |
| Output tokens + cost | Cost control | Custom metric |
| Schema validation result | Reliability tracking | Prometheus counter |
| Faithfulness score | Quality drift | LLM judge metric |
| Latency by component | Bottleneck identification | Histogram |
1
2
3
4
5
6
7
8
9
# Minimum viable observability setup
import os

os.environ["LANGCHAIN_TRACING_V2"] = "true"
os.environ["LANGCHAIN_API_KEY"]    = os.getenv("LANGSMITH_API_KEY", "")
os.environ["LANGCHAIN_PROJECT"]    = "my-llm-project"

# That's it — all LangChain/LangGraph calls are now traced
# View at: https://smith.langchain.com
Observability Maturity Quick Reference
| Capability | When to Add |
|---|---|
| Basic request/response logging | Day 1 (always) |
| Structured prompt + retrieval traces | Week 1 |
| Cost tracking per request | Month 1 |
| LLM-as-judge quality scoring | Month 1–2 |
| Automated alerts on quality drop | Month 2 |
| A/B experiment tracking | Month 3+ |
| Real-time drift detection | Month 6+ |
Production Engineering Notes
On reliability: The most reliable systems are built with defense in depth — multiple independent validation layers, graceful degradation paths, circuit breakers, and comprehensive observability. No single component should be a single point of failure.
On evaluation: Automated evaluation enables speed; human evaluation provides ground truth. Calibrate your automated judges regularly against human labels. A 10-point quality regression detected in CI costs hours to fix; the same regression discovered after deployment costs days or weeks of user trust.
On iteration: LLM systems improve through measurement, not intuition. Every prompt change, model upgrade, and retrieval configuration should be evaluated against a representative dataset before deployment. Blind experimentation is expensive; instrumented experimentation is invaluable.
On operations: Monitor cost, latency, and quality as a unified picture. A system that is fast and cheap but inaccurate is not production-grade. A system that is accurate but 10× over budget is not sustainable. The engineering goal is acceptable quality at acceptable cost within acceptable latency.
Key Takeaways
- Enable LangSmith tracing from day one — the overhead is negligible, the value is immediate
- Trace each component separately: retrieval, prompt, generation, tool calls, validation
- Log metadata (token counts, costs, latency, IDs) but never raw prompt/response content in production logs
- Sample 5% normally; capture 100% of errors and slow requests
- Alert on quality (faithfulness drop) as aggressively as you alert on errors
- Cost per request should be a dashboard metric from day one; surprises compound
- Connect traces to eval failures — when a judge flags a response, you should be able to see the full trace
- Observability is not optional in production; it is what makes debugging possible
Conclusion
LLM observability is the operational layer that turns a model-powered application into a manageable product. It turns vague complaints into traceable failures and transforms model behavior from something mysterious into something diagnosable. Without it, teams debug by anecdote, optimize by intuition, and respond to production incidents with guesswork. With structured tracing, cost dashboards, quality metrics, and automated alerting, the same team can diagnose failures in minutes, detect quality drift before users notice, and iterate on the system with confidence. The investment in observability is never wasted — every trace, every quality score, and every cost metric accumulated in production becomes evidence for the next improvement decision. Observability is not a dashboard — it is the feedback loop that allows a production AI system to improve over time with evidence rather than intuition.